I am having trouble plotting heat and moisture flows and flux densities. I have checked the boxes to include them in the results file but when I try and plot them using the 1-d graphing application (WUFI Graph) I cannot select a grid element form the select values window. I see that it says flow through a fulx dectetor area, does that mean I need to set up a dectector before I run the simulation? If so how do I do that?
Thanks,
Ben
Fluw and Flux densities
-
Manfred Kehrer
- WUFI International Support Team

- Posts: 351
- Joined: Thu Mar 10, 2005 2:17 am -1100
- Location: Northbrook, IL; USA
- Contact:
Dear Ben,
no you don´t have to specify the area of interest before the calculation.
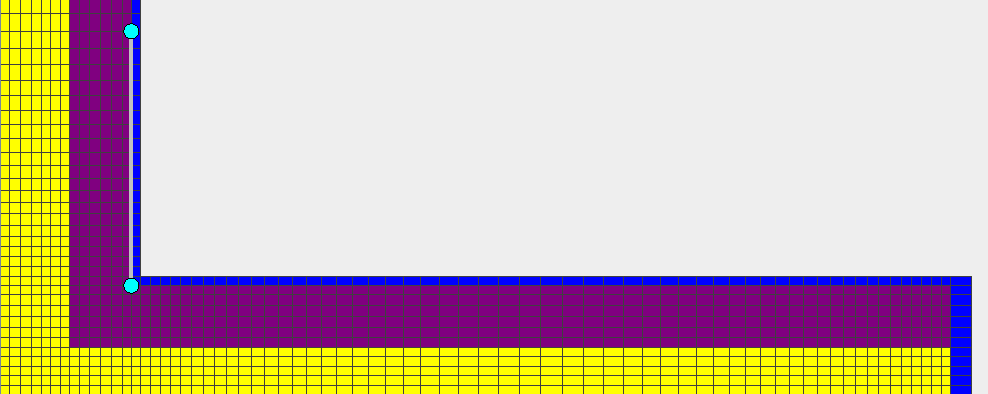
Just define one horizontal or one vertical path, on which the flux to be calculated in the WUFI Graph. Use left mouse clicks on a cross point of the element border lines to define the end points of that path. The result should be similar to the following picture (the cyan dots are the end points).

Sometimes it´s not easy to hit that pixel. In that case please use the zoom option (Shift and mouse zoom). The blue marked area is the border condition which can not be evaluated.
Best Regards,
no you don´t have to specify the area of interest before the calculation.
Just define one horizontal or one vertical path, on which the flux to be calculated in the WUFI Graph. Use left mouse clicks on a cross point of the element border lines to define the end points of that path. The result should be similar to the following picture (the cyan dots are the end points).

Sometimes it´s not easy to hit that pixel. In that case please use the zoom option (Shift and mouse zoom). The blue marked area is the border condition which can not be evaluated.
Best Regards,
Manfred
Wiss, Janney, Elstner Associates, Inc.
Official WUFI® Collaboration Partner for USA/Canada
Enjoy WUFI® .... It is easy and complex.
Wiss, Janney, Elstner Associates, Inc.
Official WUFI® Collaboration Partner for USA/Canada
Enjoy WUFI®
