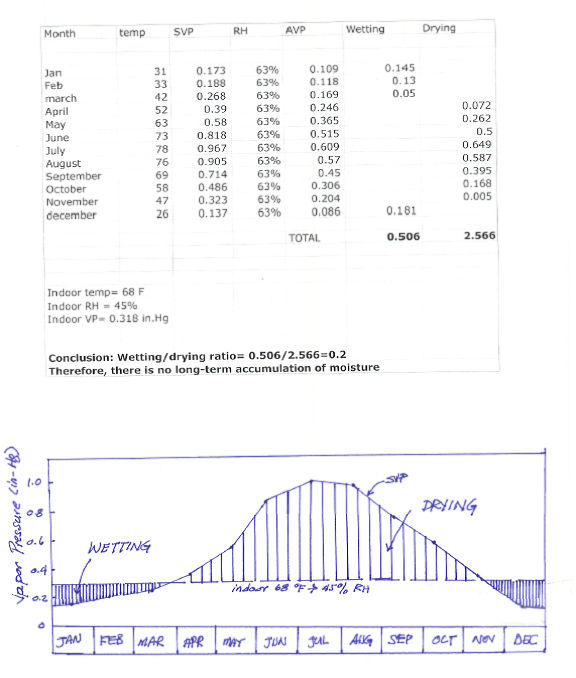
I am reviewing hand calculations that produced for a wall section for one year the Saturated Vapor Pressure, Relative Humidity, Average Vapor Pressure and the wetting and drying of the wall throughout a year. What WUFI graph or combination of graphs will enabe me to check the results? The graph of the hand calcs. showed wetting for Jan. to March and part of Nov. and Dec. The other months were dry (ing).
Thanks as always.
C. Furtaw
Graph Compairson to Hand Calculations
-
C. Furtaw
- WUFI User

- Posts: 85
- Joined: Tue Jul 19, 2005 2:04 am -1100
- Location: Malvern, Pennsylvania
- Contact:
Graph Compairson to Hand Calculations
Charles E. Furtaw, P.E.

Re: Graph Compairson to Hand Calculations
Dear Mr. Furtaw,
WUFI's results contain, among other things, the profiles (i.e. distributions across the component) of temperature, relative humidity and water content. Go to Inputs | Calculation Period/Profiles to enter in the timetable the points in time for which you want these profiles. For example, you may want a profile for the first of each month, or in the middle of each month, or every 20 days etc. Profiles for the start and the end of the calculation are produced automatically.
You can view these profiles in the dialog Outputs | Result Graphs. If you need them as numerical data, export them to ASCII files by choosing Outputs | ASCII Export. Check the profiles you want to export, specify a file name and click on "Export to file(s)".
For each of the specified points in time you get profiles for temperature, relative humidity and water content. From these you may derive profiles for saturation vapor pressure and vapor pressure. Import the profiles for temperature and relative humidity into Excel or a similar program and compute the saturation vapor pressure corresponding to each temperature with an appropriate formula. Then multiply the saturation vapor pressure with the relative humidity (expressed as a fraction between 0 and 1, not as a percentage) to obtain the vapor pressure.
WUFI also produces 'courses' (i.e. the evolution in time) for several quantities, among them the water contents of the individual materials and the total water contents in the construction. You can view these curves in the Result Graphs dialog, and you can export them to ASCII files like you did with the profiles. These curves will tell you whether the wall section will dry out or not, and which layers dry out how quickly (or not).
Regards,
Thomas
-
C. Furtaw
- WUFI User
- Posts: 85
- Joined: Tue Jul 19, 2005 2:04 am -1100
- Location: Malvern, Pennsylvania
- Contact:
Thomas,
I did as you suggested and got the following file. How do I interpet this? There were 4 columns in the output.
0.000000E+0000 9.468434E+0000 8.269262E+0001 2.440135E+0000
2.971271E-0003 9.533761E+0000 8.088805E+0001 2.411359E+0000
6.341880E-0003 9.604516E+0000 7.924921E+0001 2.385227E+0000
1.016549E-0002 9.680827E+0000 7.764229E+0001 2.359604E+0000
1.450301E-0002 9.762605E+0000 7.606881E+0001 2.334514E+0000
1.942349E-0002 9.849546E+0000 7.459630E+0001 2.311033E+0000
2.500528E-0002 9.941121E+0000 7.327500E+0001 2.289964E+0000
3.133726E-0002 1.003652E+0001 7.208446E+0001 2.270981E+0000
3.852026E-0002 1.013459E+0001 7.094235E+0001 2.252769E+0000
4.666865E-0002 1.023364E+0001 6.977058E+0001 2.234084E+0000
5.514256E-0002 1.032315E+0001 6.867270E+0001 2.222566E+0000
6.295615E-0002 1.039445E+0001 6.777329E+0001 2.214734E+0000
6.987819E-0002 1.044921E+0001 6.708878E+0001 2.208774E+0000
7.601039E-0002 1.049137E+0001 6.658574E+0001 2.204394E+0000
8.144289E-0002 1.052390E+0001 6.623029E+0001 2.201299E+0000
8.625552E-0002 1.054904E+0001 6.599126E+0001 2.199217E+0000
9.051902E-0002 1.056848E+0001 6.584174E+0001 2.197915E+0000
9.429604E-0002 1.058354E+0001 6.575929E+0001 2.197197E+0000
9.764208E-0002 1.059520E+0001 6.572583E+0001 2.196906E+0000
1.006063E-0001 1.060425E+0001 6.572714E+0001 2.196918E+0000
1.033911E-0001 1.061367E+0001 6.571586E+0001 9.197924E-0001
1.062900E-0001 1.062546E+0001 6.566621E+0001 9.178077E-0001
1.094265E-0001 1.063812E+0001 6.561418E+0001 9.157341E-0001
1.128203E-0001 1.065174E+0001 6.555957E+0001 9.135638E-0001
1.164924E-0001 1.066638E+0001 6.550204E+0001 9.112854E-0001
1.204656E-0001 1.068215E+0001 6.544117E+0001 9.088818E-0001
1.247645E-0001 1.069915E+0001 6.537627E+0001 9.063284E-0001
1.292329E-0001 1.071680E+0001 6.530915E+0001 9.036980E-0001
1.335319E-0001 1.073380E+0001 6.524419E+0001 9.011611E-0001
1.375050E-0001 1.074956E+0001 6.518322E+0001 8.987885E-0001
1.411771E-0001 1.076418E+0001 6.512560E+0001 8.965540E-0001
1.445709E-0001 1.077777E+0001 6.507092E+0001 8.944398E-0001
1.477075E-0001 1.079040E+0001 6.501888E+0001 8.924335E-0001
1.506063E-0001 1.080216E+0001 6.496928E+0001 8.905267E-0001
1.533911E-0001 1.081366E+0001 6.883971E+0001 5.924903E-0001
1.562987E-0001 1.082572E+0001 7.150581E+0001 6.709744E-0001
1.594624E-0001 1.083871E+0001 7.389192E+0001 7.542834E-0001
1.629048E-0001 1.085270E+0001 7.635947E+0001 8.573716E-0001
1.664925E-0001 1.086713E+0001 7.806054E+0001 9.413246E-0001
1.699350E-0001 1.088086E+0001 7.836850E+0001 9.578698E-0001
1.730987E-0001 1.089342E+0001 7.726752E+0001 9.006921E-0001
1.760062E-0001 1.090495E+0001 7.486187E+0001 7.924882E-0001
1.787904E-0001 1.091126E+0001 7.485880E+0001 5.027823E+0001
1.817345E-0001 1.091278E+0001 7.485538E+0001 5.027642E+0001
1.850183E-0001 1.091426E+0001 7.484797E+0001 5.027250E+0001
1.886811E-0001 1.091562E+0001 7.483411E+0001 5.026516E+0001
1.927666E-0001 1.091681E+0001 7.481202E+0001 5.025346E+0001
1.973236E-0001 1.091771E+0001 7.477968E+0001 5.023634E+0001
2.024064E-0001 1.091820E+0001 7.473444E+0001 5.021239E+0001
2.080757E-0001 1.091809E+0001 7.467313E+0001 5.017993E+0001
2.143993E-0001 1.091718E+0001 7.459228E+0001 5.013712E+0001
2.214527E-0001 1.091517E+0001 7.448818E+0001 5.008201E+0001
2.293200E-0001 1.091171E+0001 7.435738E+0001 5.001275E+0001
2.380952E-0001 1.090632E+0001 7.419750E+0001 4.992810E+0001
2.478831E-0001 1.089840E+0001 7.400880E+0001 4.982819E+0001
2.588005E-0001 1.088718E+0001 7.379634E+0001 4.971571E+0001
2.709777E-0001 1.087164E+0001 7.357146E+0001 4.959665E+0001
2.838193E-0001 1.085162E+0001 7.335786E+0001 4.948355E+0001
2.959965E-0001 1.082909E+0001 7.315508E+0001 4.937619E+0001
3.069139E-0001 1.080592E+0001 7.290483E+0001 4.924369E+0001
3.167017E-0001 1.078268E+0001 7.252655E+0001 4.904341E+0001
3.254770E-0001 1.075976E+0001 7.196210E+0001 4.874455E+0001
3.333443E-0001 1.073748E+0001 7.120167E+0001 4.834194E+0001
3.403976E-0001 1.071605E+0001 7.029019E+0001 4.785935E+0001
3.467212E-0001 1.069561E+0001 6.930417E+0001 4.733730E+0001
3.523906E-0001 1.067627E+0001 6.830305E+0001 4.680725E+0001
3.574734E-0001 1.065807E+0001 6.730630E+0001 4.627951E+0001
3.620303E-0001 1.064105E+0001 6.641753E+0001 4.580894E+0001
3.661158E-0001 1.062520E+0001 6.612569E+0001 4.565442E+0001
3.697786E-0001 1.061048E+0001 6.732816E+0001 4.629108E+0001
3.730624E-0001 1.059688E+0001 7.039980E+0001 4.791739E+0001
3.760065E-0001 1.058441E+0001 7.401128E+0001 4.982951E+0001
3.784398E-0001 1.052875E+0001 7.663388E+0001 5.778445E+0000
3.805229E-0001 1.042838E+0001 7.738017E+0001 5.873682E+0000
3.826062E-0001 1.032805E+0001 7.803648E+0001 5.957435E+0000
3.848979E-0001 1.021756E+0001 7.867117E+0001 6.037729E+0000
3.873978E-0001 1.009640E+0001 7.928743E+0001 6.110293E+0000
3.898976E-0001 9.973758E+0000 7.992109E+0001 6.184906E+0000
Charles E. Furtaw, P.E.
The first column contains x-coordinates across the wall section, the second column the temperatures for those coordinates, the third column the relative humidity (in percent) and the fourth column the water content. Plot the second column against the coordinates in the first column to see the temperature distribution, and likewise for the third and fourth column.C. Furtaw wrote:I did as you suggested and got the following file. How do I interpet this? There were 4 columns in the output.
Please refer to the online help for the dialog Outputs | ASCII-Export and links therein for more information on the exported data.
Regards,
Thomas
Dear Mr. Furtaw,
2.971271E-0003 is the same as 2.971271E-3 or 0.002971271. The zeros are just placeholders to ensure clean formatting when numbers with different decimal exponents are tabulated. For example, the table
2.971271E-3
3.785532E-274
becomes thus a neater table
2.971271E-0003
3.785532E-0274
Regards,
Thomas
-
C. Furtaw
- WUFI User
- Posts: 85
- Joined: Tue Jul 19, 2005 2:04 am -1100
- Location: Malvern, Pennsylvania
- Contact:
Thomas,
With he information that you provided and using the data I supplied above below is what I derive from this data in the 2nd and next to last rows that I think was for the 11th month:
2nd row:
x coord. .00297 in.
temp. = 9.5 F
82% RH &
2.4 water content (I have to cehck the units)
next to last row:
x coord. .387 in.
temp. = 10 F
79.9% RH &
6.11 water content
First, the x coor. confuses me since the wall section is approx. 15.3" thick. & the avg. temp seems low or is the data metric but my input is in-lb?
Thanks,
C. Furtaw
Charles E. Furtaw, P.E.
The ASCII output is always metric, no matter in which units you input the data or do the calculation. To convert to in-lb units please refer to the "Conversion Factor Table" in WUFI's online help. You can use the "Contents" button of the help window or the Search function to find this table in the online help system.C. Furtaw wrote:First, the x coor. confuses me since the wall section is approx. 15.3" thick. & the avg. temp seems low or is the data metric but my input is in-lb?
For example, the x-coordinate 0.387 is in meters and converts to 15.24 inches, so this is close to the right-hand surface of your 15.3" thick wall section.
Regards,
Thomas
I'm not sure at which spot in the wall you want to evaluate the vapor pressure (at a single spot? As an average over the wall or over part of the wall?) and whether the monthly values are averaged over the month or taken at a specific point in time.C. Furtaw wrote:
I understand how to use the WUFI data but is there a way to use the output to duplicate the above?
If you want the vapor pressure at a specific location, set a monitoring position there. WUFI will give you the hourly temperatures, relative humidities and water contents for that spot. From the temperatures you can compute the saturation vapor pressures. If you need the hourly data averaged over each month, you can do that with any spreadsheet program.
If you want the results averaged over some region within the wall, cover the region with as many monitoring positions as you find necessary.
If you want an average over some region and want it computed as precisely as possible with the available data, let WUFI give you a profile for each month and average over all the grid nodes that fall within the region in question. Of course, this gives you only data for specific points in time, not monthly averages.
Regards,
Thomas
-
C. Furtaw
- WUFI User
- Posts: 85
- Joined: Tue Jul 19, 2005 2:04 am -1100
- Location: Malvern, Pennsylvania
- Contact:
Thomas,
The graph was for an average for the wall as constructed. The temperature and RH are averages for the month.
With the above in mind what is the best analysis to determine if a wall (or specific point) has wetting or drying periods? Also, the graph is derived from hand calculations where WUFI would provide a more specific and detailed analysis.
The wall section is 4" Face Brick, 2" air, 1" insulation and, 8" CMU. Would the best position to check for wetting and drying be at the face of the CMU?
Thanks,
C. Furtaw
Charles E. Furtaw, P.E.